-2.png)
Grains finished mixed after today’s surprise USDA report. Let’s get right into the numbers.
Corn
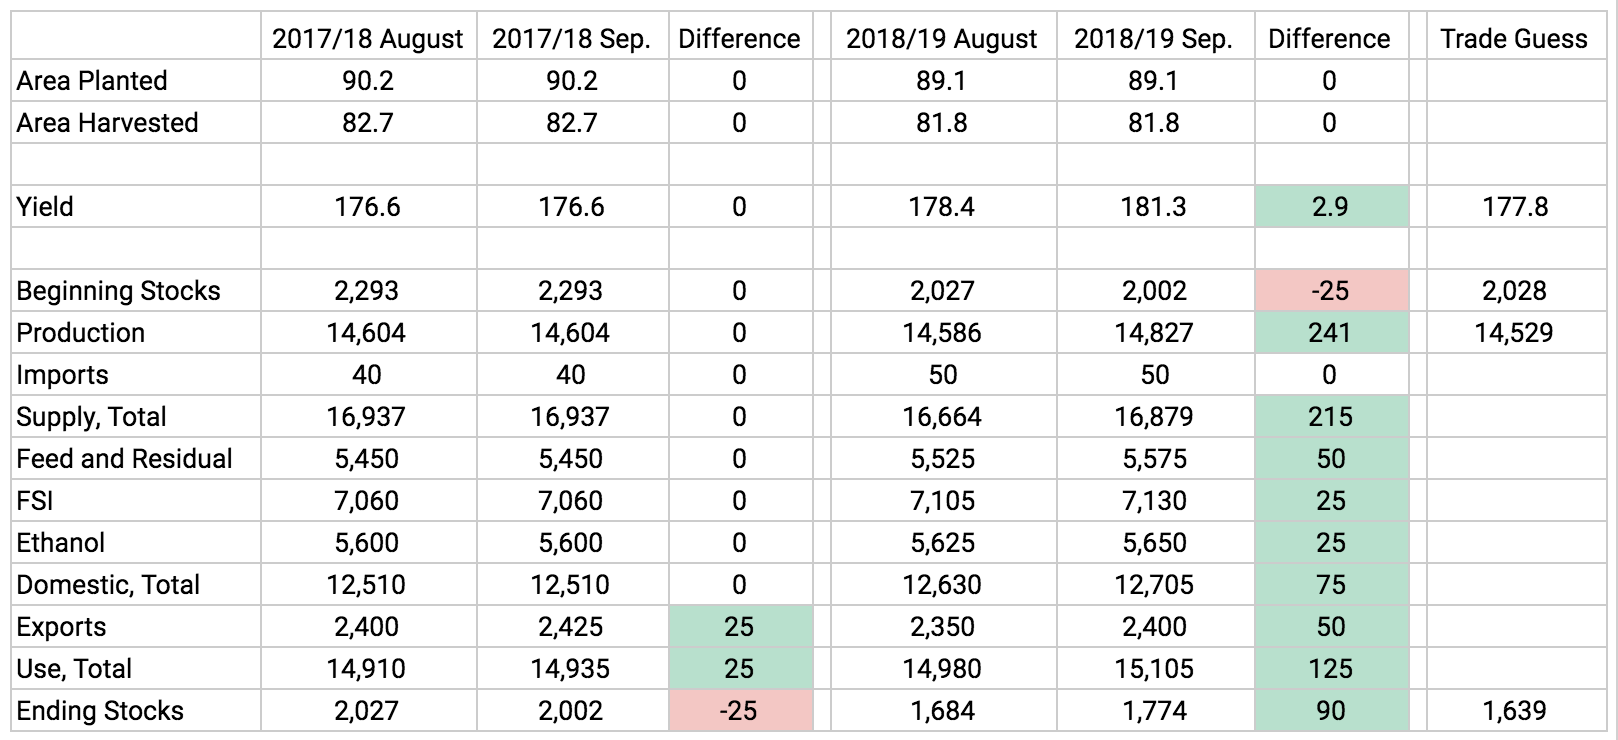
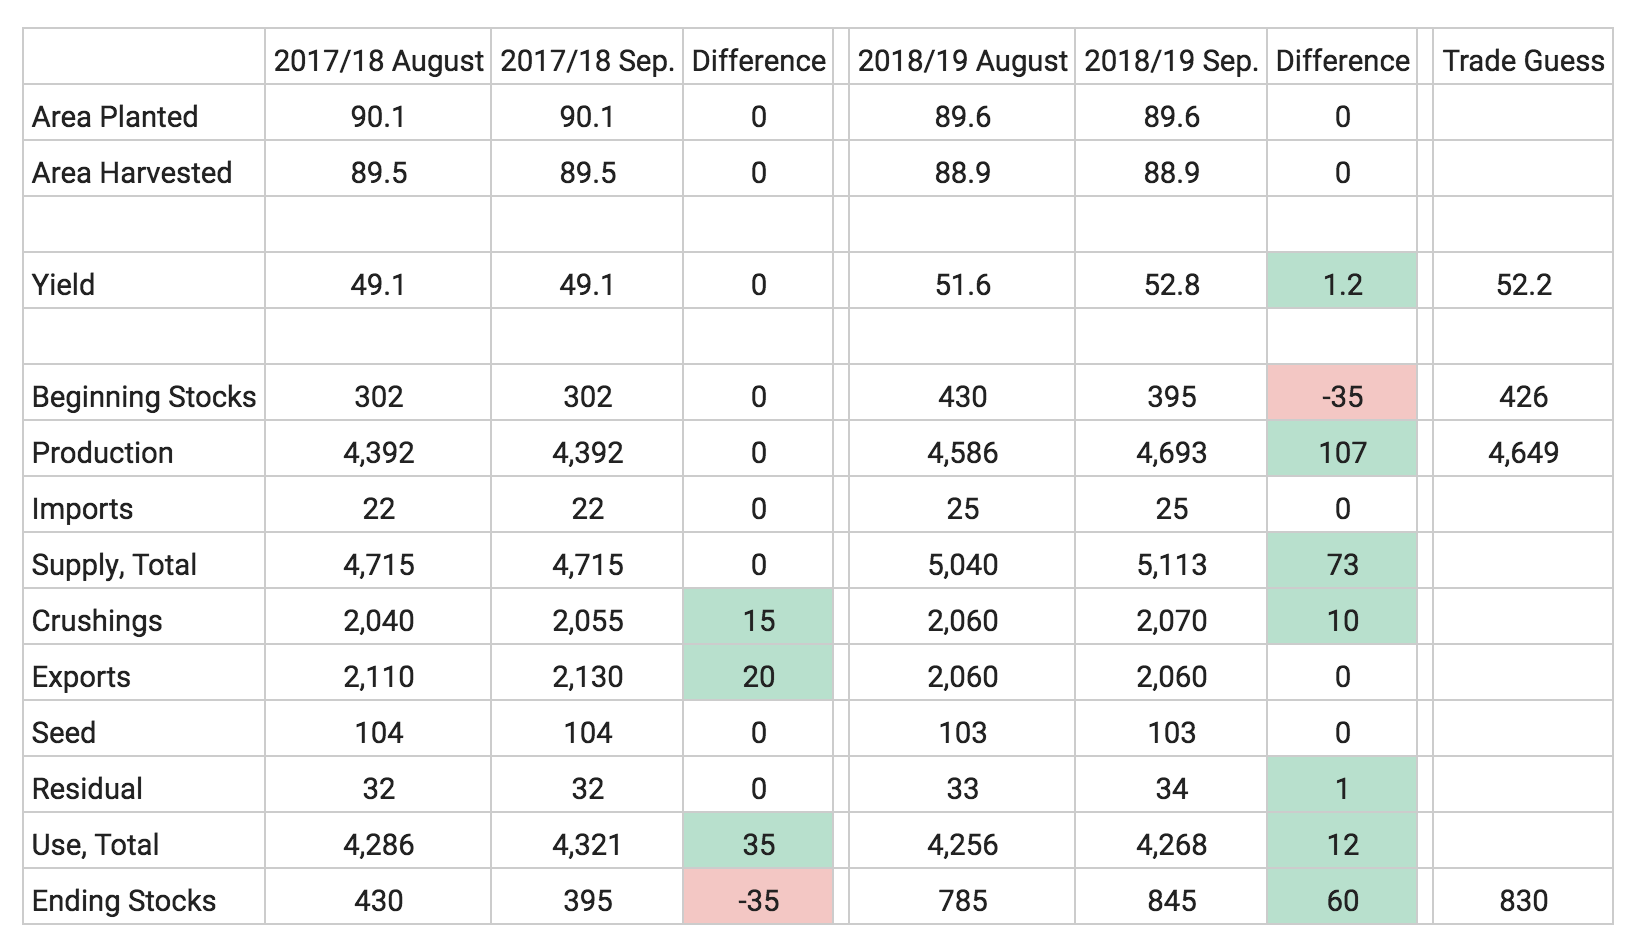
- USDA raised the yield to 181.3 bpa. This is 2.9 bpa higher than last month and 3.5 bpa higher than the average trade estimate.
- Old crop ending stocks were cut 25 million bushels on increased exports.
- New crop demand was revised higher in all categories:
- + 50 million bushels in feed and residual
- + 25 million bushels in ethanol
- + 50 million bushels in exports
- Ending stocks were 90 million bushels higher than last month and 135 million bushels higher than the average trade guess at 1.774 billion bushels.
The biggest shock here was obviously the corn yield.
The USDA is using the highest population and ear weight ever. That’s a hard number to believe, as it goes well against our yield model, as well as what we’re hearing across the country.
A lot of producers are seeing ear weights closer to those they had in 2015. Let’s run the math here with that ear weight and the current USDA population. I can’t argue the population since we got off to a great start this year.
Assuming an ear weight of .335 lbs/ear and a population of 29,400 we end up with 175.875 bpa:
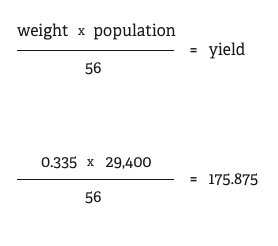
I prefer to believe this number, as our yield model currently shows the most probable yield at 175.08 bpa. The USDA’s 181.3 bpa estimate is out of the possible range of our model. That doesn’t mean it can’t happen, but that possible range plots all previous variations. It would be a first if that yield was final.
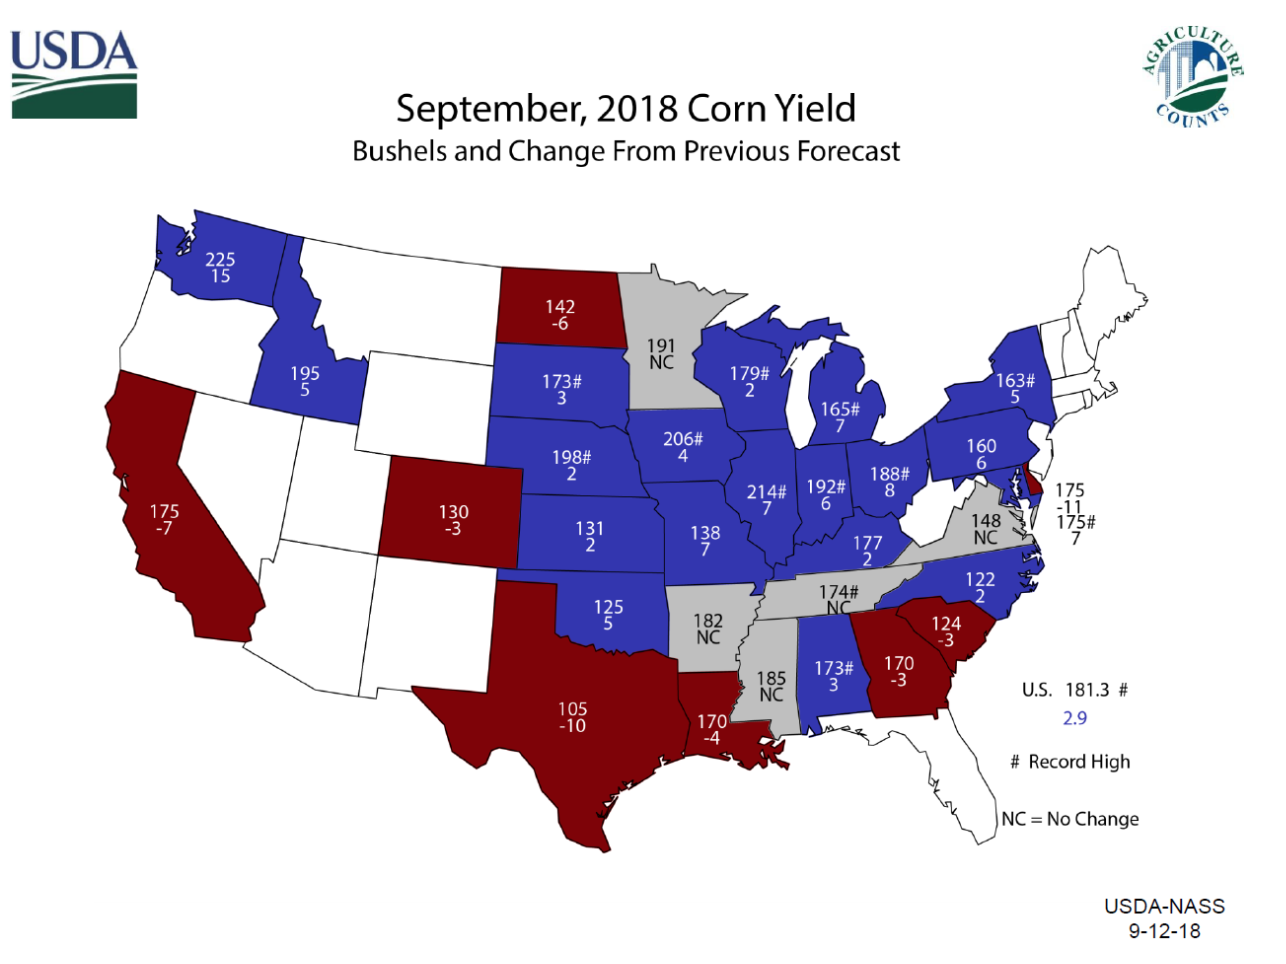
Breaking down state by state details we saw increases in all of the “I states.” Illinois’ yield was bumped 7 bpa to 214. Indiana was up 8 bpa to 192, and Iowa was 4 bpa higher to 206.
Cuts were made only in lower production states: North Dakota, California, Colorado, Texas, Louisiana, Georgia, and South Carolina.
Mississippi, Arkansas, Tennessee, Virginia, and Minnesota were unchanged.
All other states saw increased corn yields.
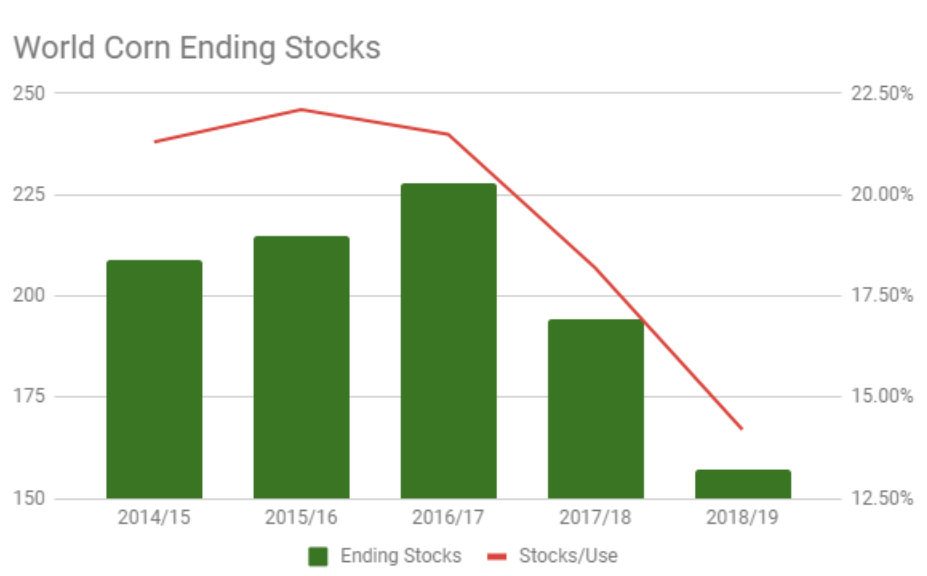
World corn ending stocks were revised higher to 157.03 million metric tons on a bump in production and higher beginning stocks. Feed usage was increased as was overall usage.
This still puts us in a bullish looking world situation.
Soybeans
- Old crop ending stocks were cut 35 million bushels on an increased crush (15 million bushels) and exports (20 million bushels).
- Yield was revised 1.2 bpa higher to 52.8 bpa (trade guess was 52.2).
- Demand side adjustments were small, with only a 12 million bushel increase in usage (numbers don’t add up due to rounding):
- Crushings: + 10 million bushels
- Residual: + 1 million
- Ending stocks were 60 million bushels higher than last month and 15 million bushels higher than the average trade estimate at 845 million bushels.
I can’t argue the yield number too much here. It is still higher than our model and range, but not totally unbelievable given the difficulty in estimating soybean yields.
Our model shows 50.7 bpa with a range of 49.3 to 52.1.
The calculation for implied pod weight the USDA uses is rather high, though I have no basis to argue it. I also have no basis to argue pod counts. Let’s run the numbers using an average of the last two years, just to see what we come up with.
A very simple formula is weight x pods per 18 sq. ft. x 0.0889. Let’s split the difference between the last two years for weight at 0.323 grams per pod and the pod count at 1,775 per 18 sq. ft. We end up with 50.97 bpa, which matches up with our model. A lot of crop tours are pointing to higher yields than that, and again, I can’t argue against that simply because the model isn’t as accurate for soybeans as it is for corn.
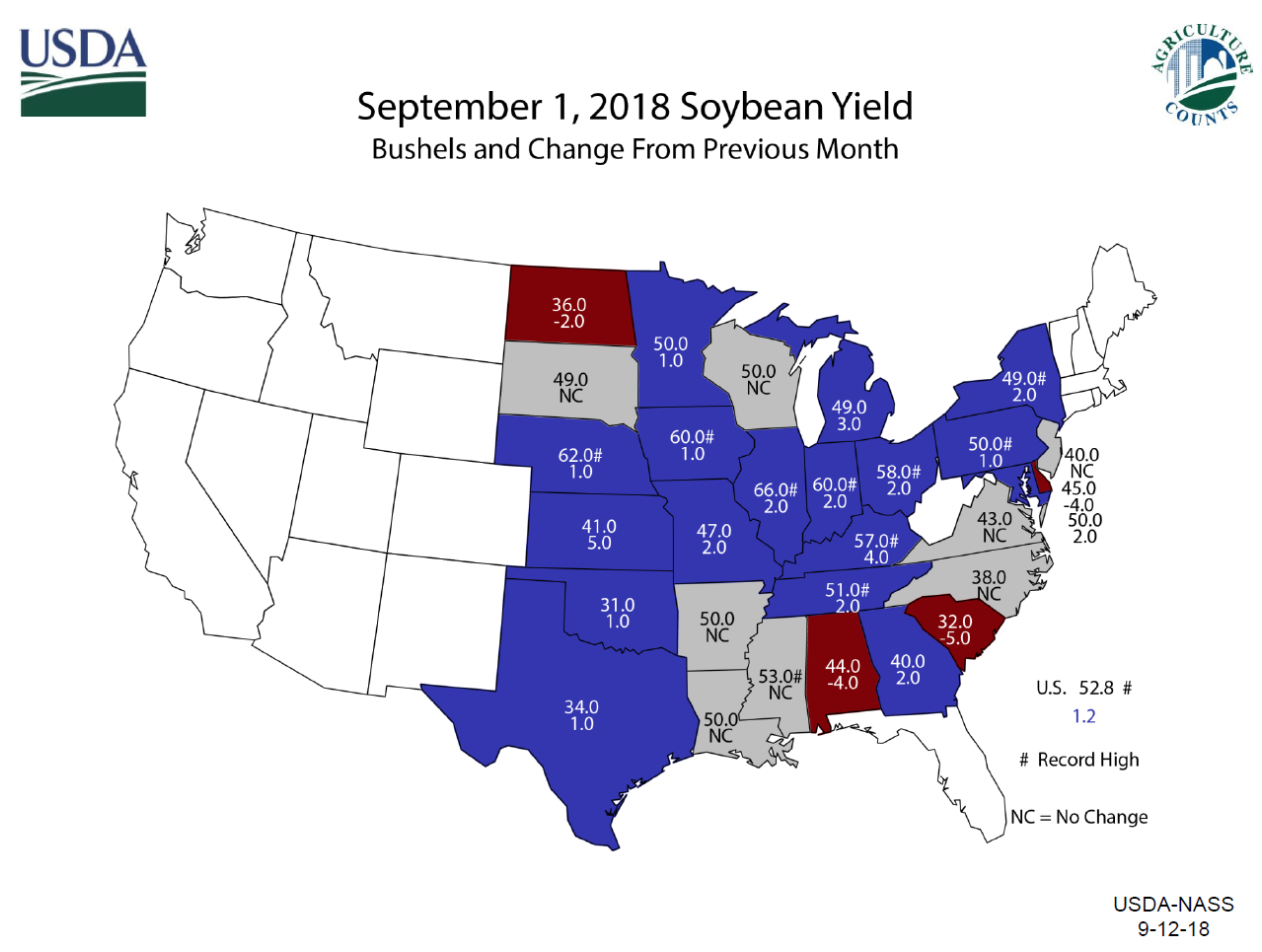
State yields were cut in North Dakota, Alabama, South Carolina, and Delaware.
There were no changes to South Dakota, Wisconsin, New Jersey, Virginia, North Carolina, Arkansas, Mississippi, and Louisiana.
All other states were revised higher.
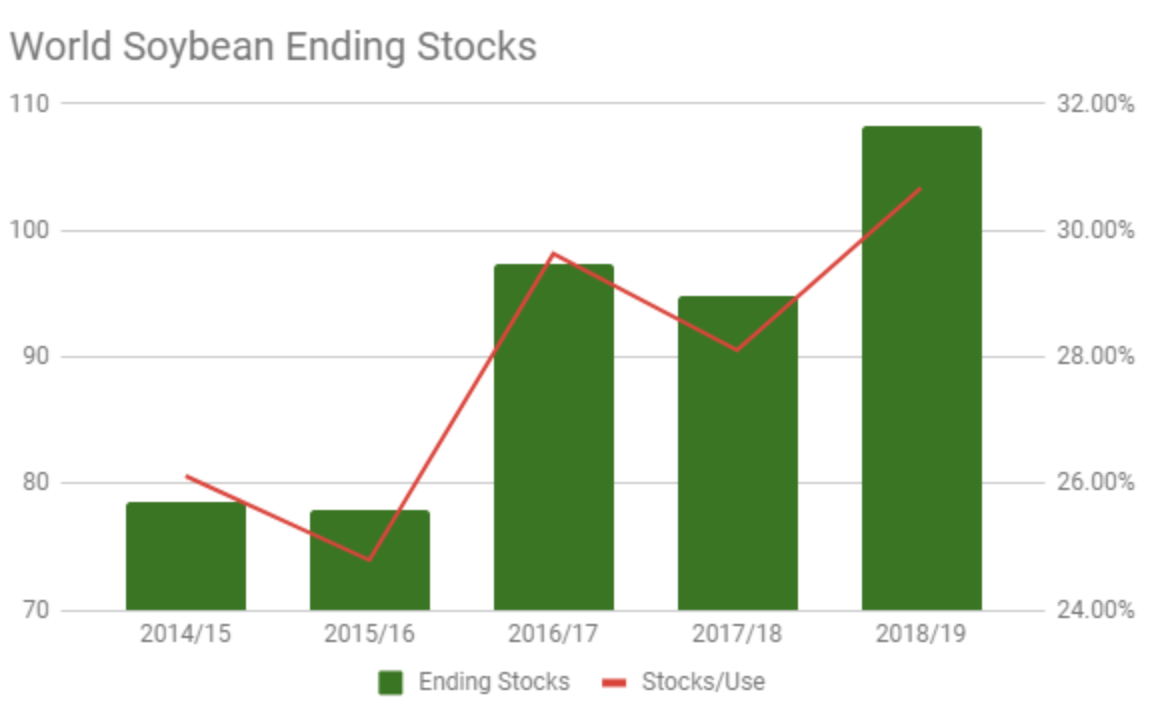
World soybean ending stocks were revised higher to 108.26 million metric tons on higher production and a small reduction in usage.
Chinese imports were reduced by a million metric tons to 94 MMT and their crush was cut from 95 to 93.5 MMT.
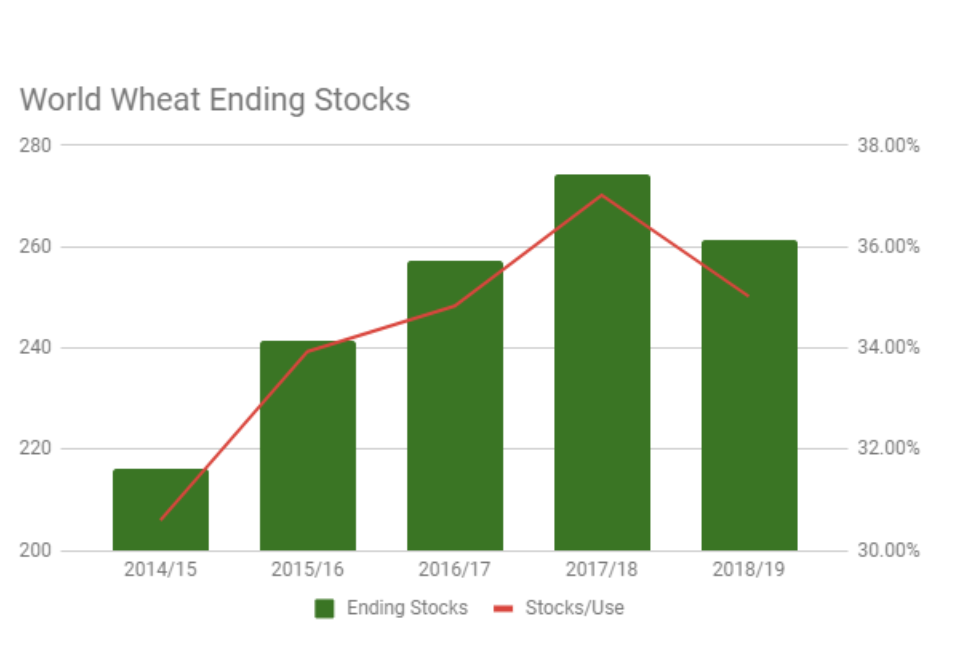
Wheat
- There were no changes to the 2018/19 balance sheet.
- World supplies were revised higher on an increase in production and beginning stocks.
- 2017/18 U.S. wheat had offsetting demand adjustments with an increase in food usage and a decrease in feed/residual.